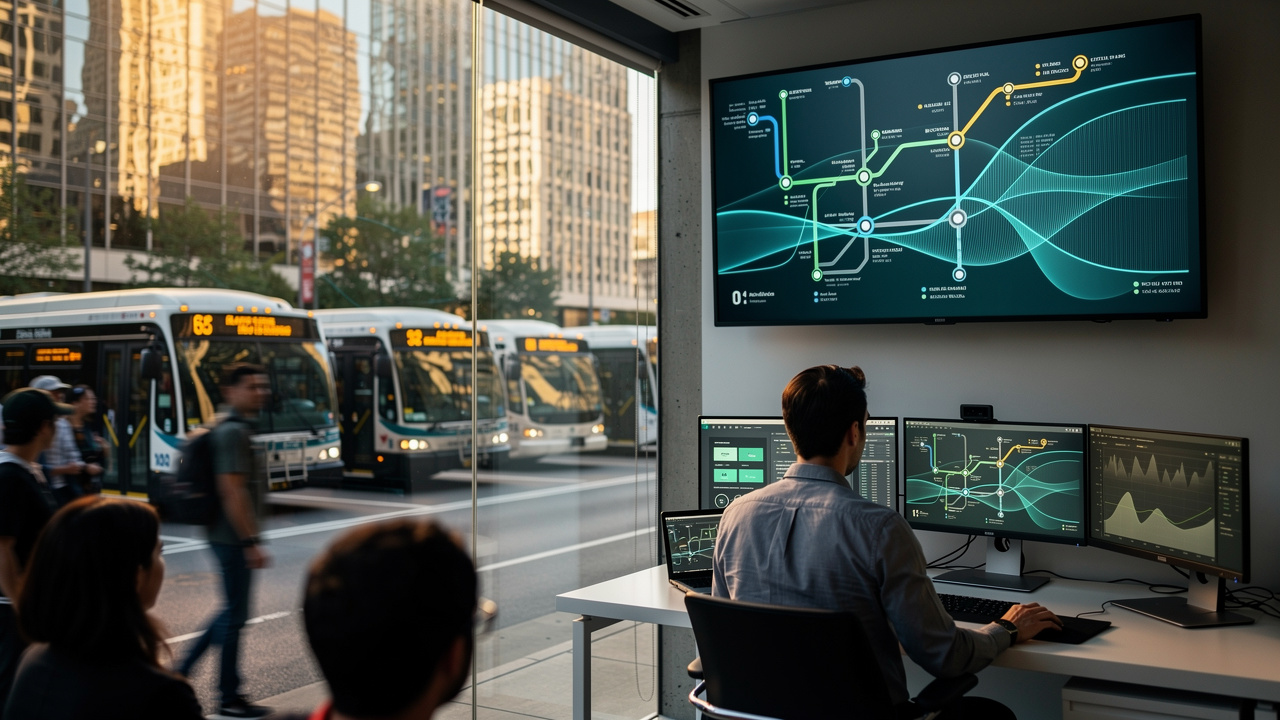
Reducing Bus Bunching with Forecasting and Dispatcher Recommendations
Urban bus routes are affected by changing passenger demand, traffic delay, and uneven boarding times. When one bus falls behind, more passengers may gather at its stops, while the bus behind it encounters fewer passengers and moves faster. This process can lead to bus bunching and longer, less reliable waits. A forecasting and dispatch process can help teams identify these conditions earlier and select practical schedule-constrained actions.
This worked example combines multi-horizon passenger-demand forecasting with large language model (LLM) automation. The forecasting model estimates passenger demand over several future periods. A schedule and operations layer determines which actions are permitted. The LLM then converts those permitted actions into clear dispatcher recommendations. This approach supports rapid response while keeping operational decisions within defined limits.
Define the Operating Problem
Consider a 12-mile urban route with 30 stops and a scheduled headway of 10 minutes during the afternoon peak. The agency receives automatic passenger counts, vehicle location data, traffic information, and the published schedule. These sources provide a current view of route conditions, but a dispatcher also needs to know whether demand and delay are likely to increase over the next several minutes.
For this example, the objective is to reduce large gaps between buses without creating excessive holding, missed connections, or additional service outside the approved schedule. The operating process is therefore designed around three questions:
- Where is passenger demand likely to increase?
- How may that demand affect bus spacing over multiple time horizons?
- Which available actions meet the agency’s schedule and service rules?
Build Multi-Horizon Passenger-Demand Forecasts
Prepare consistent route data
Passenger counts are grouped by stop and five-minute interval. Vehicle location records are joined to these counts so that each observation includes the bus position, delay, and current headway. Additional features include day of week, time of day, recent traffic speed, weather, and known events. Data quality checks identify missing vehicle reports and unusual passenger counts before forecasting begins.
In this example, the model uses the previous 60 minutes of observations to forecast boardings at each stop for three horizons: 15, 30, and 60 minutes. A gradient-boosted model or a temporal neural network may be used, depending on data volume and agency requirements. The model produces a forecast for each stop and horizon, as well as a prediction interval that represents uncertainty.
For example, at a transfer stop the model may forecast 24 boardings in the next 15 minutes, 38 in the next 30 minutes, and 67 in the next 60 minutes. The corresponding uncertainty ranges may be 18–31, 27–50, and 44–91 boardings. These ranges matter because a dispatcher should not treat a single estimate as certain, particularly when event traffic or vehicle data are incomplete.
Connect demand to bus spacing
Passenger demand forecasts do not directly indicate that a bus will bunch. They provide one part of the operating picture. The system also calculates the distance and time between consecutive buses and compares those values with the scheduled headway. A simple risk score can combine the current gap, recent traffic delay, forecast demand, and forecast uncertainty.
Suppose the leading bus is 13 minutes behind its follower, while the scheduled headway is 10 minutes. The leading bus is delayed by five minutes in traffic, and the transfer-stop forecast indicates that demand will rise during the next 15 minutes. The follower is moving in lighter traffic. Together, these conditions suggest that the gap may widen further and that passengers may experience an increasingly long wait.
The forecasting service refreshes every five minutes. It records the forecasts, actual counts, and subsequent errors so the agency can evaluate performance by stop, time of day, and forecast horizon. This provides a practical way to determine whether the model is useful for dispatch, rather than relying only on a general accuracy score.
Apply Schedule-Constrained Dispatch Actions
The forecast is passed to a rules and optimization layer before an LLM generates a recommendation. This layer contains the actions available to dispatchers and the limits for each action. For this route, the agency may permit a short hold at an approved control point, a request for a driver to maintain scheduled speed, or a supervisor review when the predicted headway gap exceeds a defined threshold.
The system may restrict a hold to three minutes, prohibit holding at stops without adequate space, and prevent a recommendation that would cause a bus to miss a protected connection. It also checks vehicle capacity, driver hours, and route-specific operating instructions. If no available action satisfies these conditions, the system reports that dispatcher review is required.
In the worked example, the rules layer identifies a permitted two-minute hold for the following bus at a designated control point. The action is selected because it is expected to reduce the gap while remaining within the approved limit. A longer hold is rejected because it would exceed the route’s operating rule.
Use an LLM to Produce a Clear Recommendation
The LLM receives structured information, not unrestricted access to vehicle controls. Its input includes the forecast values, the current headway, the approved action, the applicable limits, and the reasons that other actions were excluded. The model is instructed to summarize this information without inventing a new action or changing the approved limit.
An example dispatcher recommendation may read:
“The gap on Route 12 is 13 minutes against a scheduled 10-minute headway. Demand at Central Station is forecast to rise over the next 15 minutes. Hold the following bus for up to two minutes at the approved control point, then reassess the gap. Do not extend the hold beyond the route limit. If the gap remains above 12 minutes, contact the supervisor.”
The recommendation is useful because it states the condition, the available action, and the next review step. The dispatcher remains responsible for the decision. The LLM does not issue commands to drivers, and each recommendation can be checked against the structured operating rules and recorded for later review.
Evaluate the Operational Benefit
Evaluation should measure both forecast quality and service outcomes. Forecast measures may include mean absolute error and interval coverage at each horizon. Operational measures may include headway variability, the number of gaps above a threshold, passenger waiting time, hold duration, and missed connections. These measures should be compared with a baseline period that accounts for route, time of day, and traffic conditions.
A pilot can begin with one route and a dispatcher-facing recommendation screen. During the first phase, the system can operate in advisory mode, allowing staff to compare recommendations with their own decisions. The agency can then review incorrect forecasts, rejected recommendations, and actions that were technically permitted but operationally unsuitable. This process supports adjustments to data quality checks, model thresholds, and route rules before wider deployment.
Conclusion
Reducing bus bunching requires timely forecasts and actions that fit the operating schedule. Multi-horizon passenger-demand forecasting helps identify where pressure may develop, while schedule constraints ensure that recommendations remain within approved service limits. LLM automation can then present the permitted response in clear language for dispatcher review. Dills Analytics LLC supports organizations in developing actionable AI solutions that connect technical models with operational requirements. A focused route pilot provides a practical starting point for testing this approach and measuring its value.